The audit method and a worked finding
You boot the starter signed in as alice@example.com, with ten empty finding skeletons waiting in findings/.
This lesson installs the audit method the rest of the chapter runs on, then proves it by filling findings/007-missing-priority.md end to end — the reference shape every later finding copies.
A junior handed an app to audit opens the source and reads it top to bottom for bugs; that path is slow and misses half of them.
The running app is the primary diagnostic surface.
Three of this chapter’s four observability findings announce themselves within a minute on a live surface — a DevTools trace, a Network row, a console line — and two have no grep target at all: a raw <img> tag and a missing config file are invisible to a source search but loud on the running app.
So drive the other way: open the app, watch its signals, and let a signal point you at the source line.
The lesson tours the five live surfaces of the booted app and which findings show up on each, then writes finding 7 in full.
The audit cadence
Section titled “The audit cadence”The discipline is four beats, run once per finding: open the running app, hold it beside the source, read one finding’s fingerprint on its surface, then write it before moving on. Writing it immediately is the beat people skip and the one that matters most. Close the panel before you record what you saw and the evidence is gone — the exact LCP timing, the Network priority, the staircase shape of the trace, none of it reconstructable from memory.
Each finding lands in the same rule-location-consequence-fix shape you used in the pre-launch audit, shipped here as findings/template.md.
A finding names the rule it violates, the location that breaks it (with the command that surfaced it), the consequence in operator- or user-visible terms, and the fix.
Walk the five diagnostic surfaces
Section titled “Walk the five diagnostic surfaces”Keep the app running in one tab and your editor in the other, and walk these five surfaces in order. Don’t fix anything yet; for each one, spot the finding’s fingerprint and note which panel is canonical for it.
1. The dashboard waterfall — Performance trace (finding 5)
Section titled “1. The dashboard waterfall — Performance trace (finding 5)”Open Chrome DevTools, switch to the Performance panel , start a recording, and navigate to /dashboard.
Stop the recording once the page paints.
http://localhost:3000/dashboardLook for a staircase. The dashboard reads four things on the server — user, organization, invoices, members — and the trace runs them in series, each waiting on the one before, with idle gaps between. That staircase is finding 5’s fingerprint: an RSC waterfall. The invoices and members reads are independent and could run at once, but the code awaits them in series and pays the sum of all four round-trips. The function looks ordinary; only the timeline’s shape reveals the waterfall, which is why the Performance trace is canonical for it.
2. The marketing hero LCP — Performance LCP marker (finding 7)
Section titled “2. The marketing hero LCP — Performance LCP marker (finding 7)”Start a fresh Performance recording and navigate to the marketing page at the root.
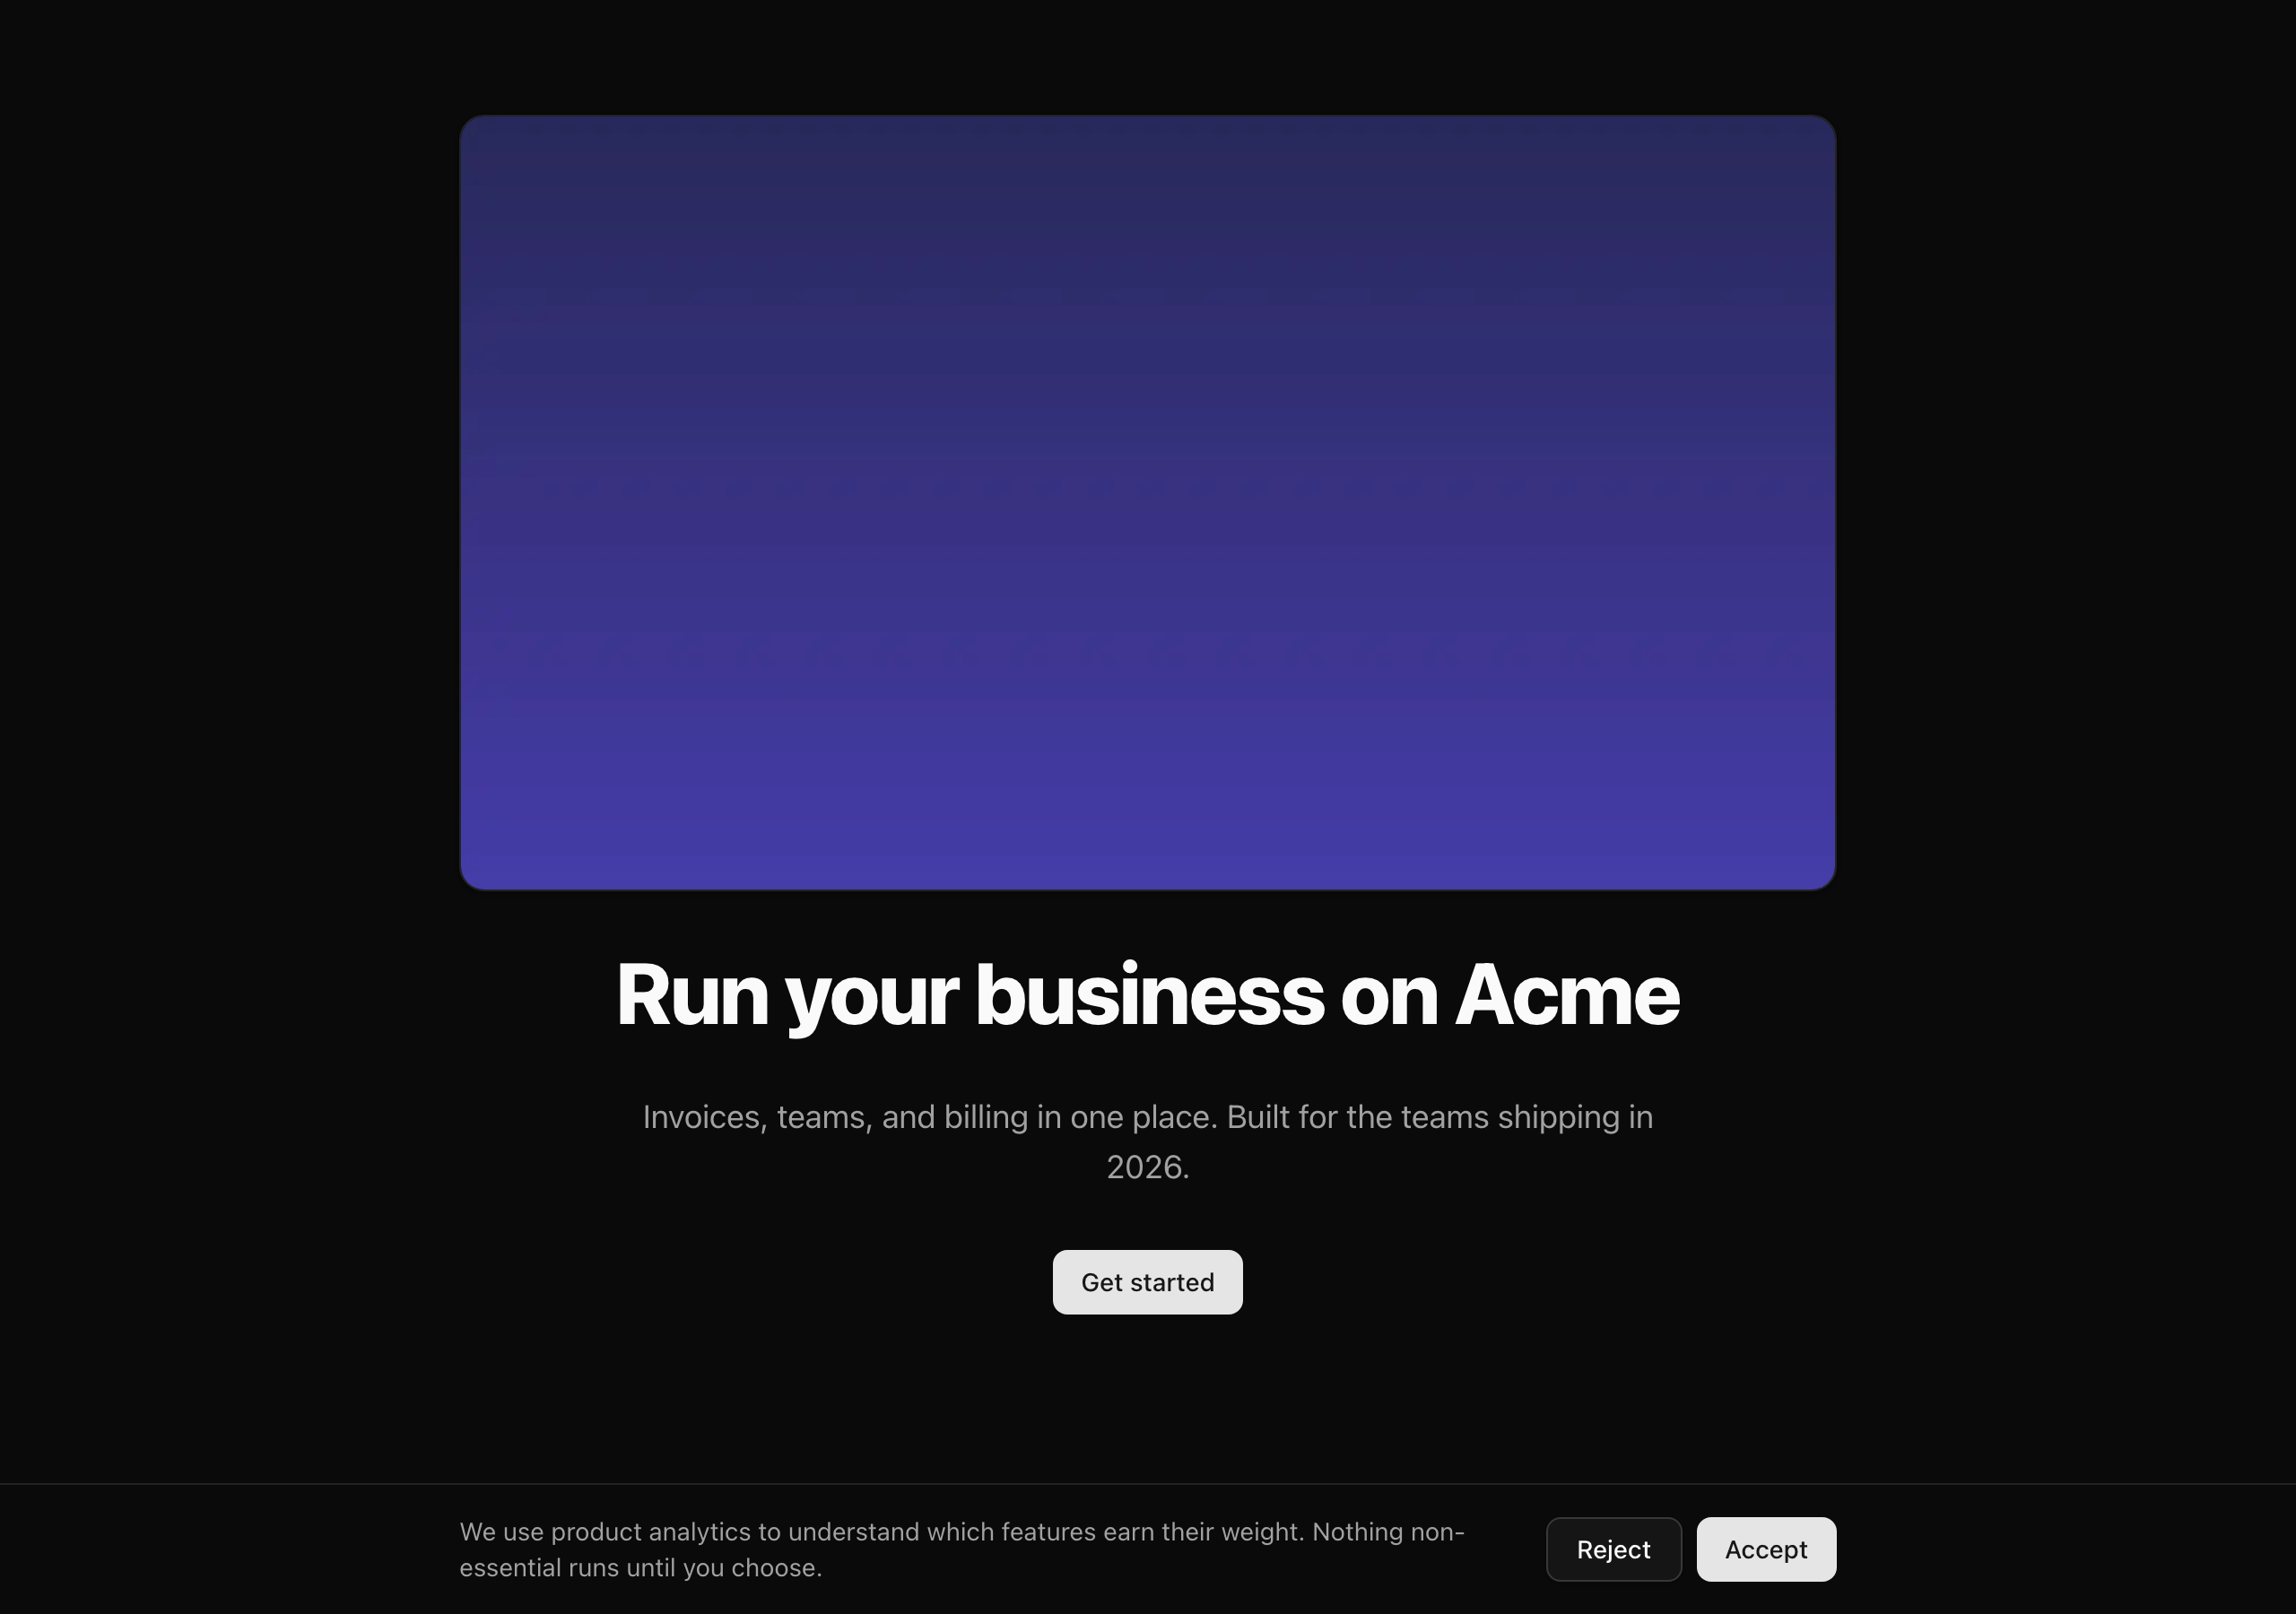
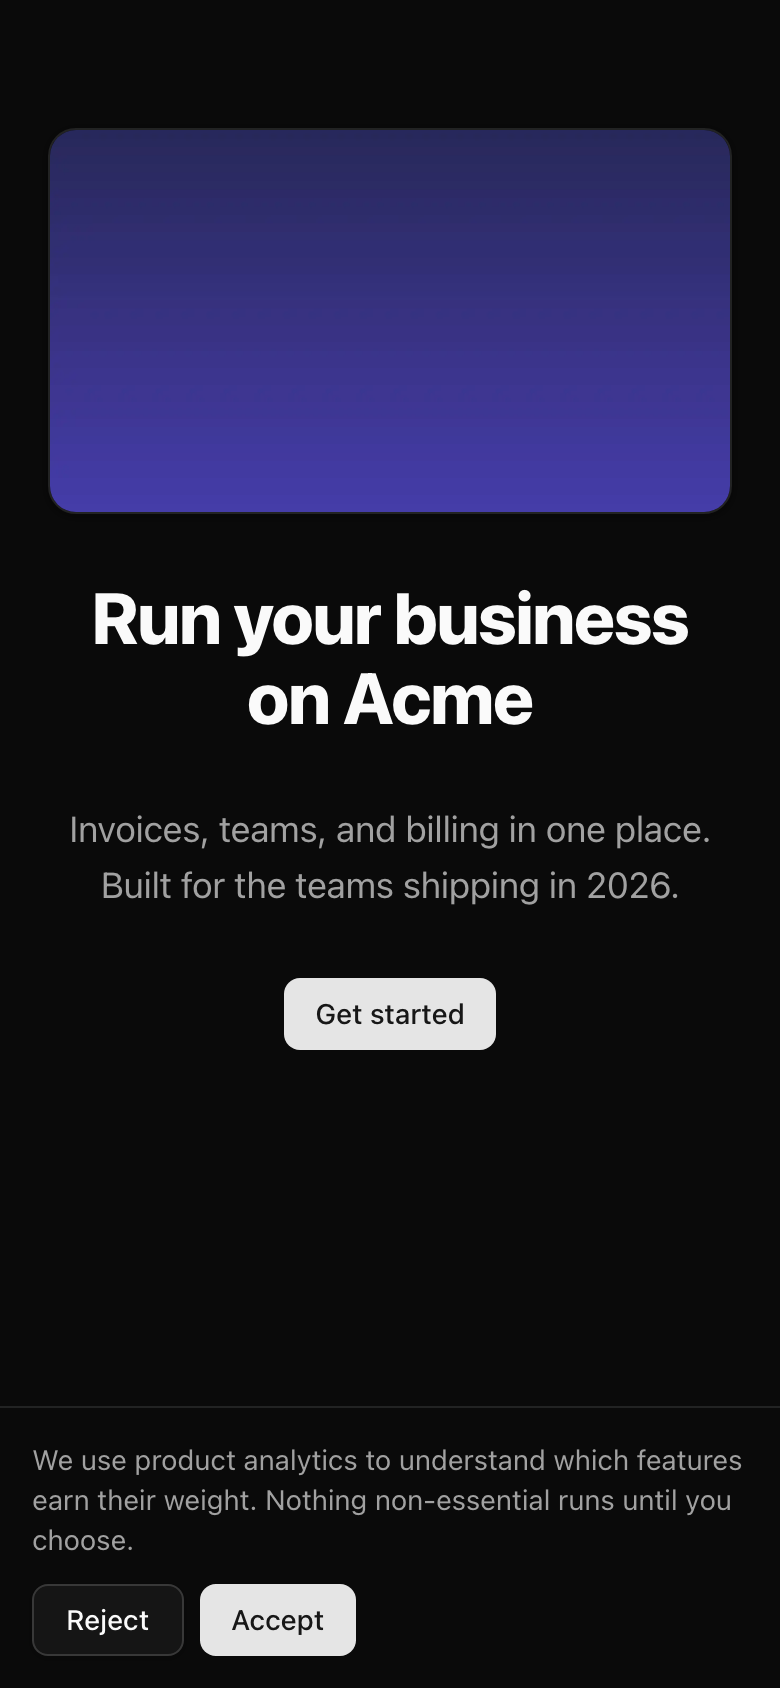
http://localhost:3000/Find the LCP marker, the Largest Contentful Paint timing DevTools labels on the timeline. It lands on the hero image, and it lands past the 2.5-second line. Cross-check it in the Network panel: the hero starts downloading late because the browser only discovers it at layout time, not when it first parses the HTML. You write this finding up in full below, so hold onto it.
3. PostHog firing pre-consent — Network panel (finding 4)
Section titled “3. PostHog firing pre-consent — Network panel (finding 4)”Open the Network panel, type ingest into its filter box, then reload the marketing page.
A request fires to /ingest on the very first load, before you have agreed to anything: PostHog capturing analytics with no consent gate in front of it.
The /ingest path is the reverse proxy the starter ships pre-wired in next.config.ts, so PostHog’s traffic rides your own domain.
The fingerprint is the request itself, appearing when it shouldn’t.
4. Sentry catching nothing — the error response (finding 1)
Section titled “4. Sentry catching nothing — the error response (finding 1)”Hit the deliberate-throw route the starter ships for exactly this purpose.
http://localhost:3000/api/test/throwThe route throws and you get the framework’s default error response. No error report appears, because Sentry is not wired: no SDK initialized, no event sent. The fingerprint is an absence — the error happens and nothing catches it. The surface is the empty Sentry dashboard you would be staring at in production, plus the missing Sentry config files on the source side.
5. The logger leaking a secret — dev console (finding 2)
Section titled “5. The logger leaking a secret — dev console (finding 2)”Watch the terminal where pnpm dev is running and replay the Stripe webhook flow so the handler logs a request.
The log line that comes out includes the raw stripe-signature header value in the clear.
That is a secret in your logs, breaking the rule that logs must be safe to read at 3am with the whole company watching. The fingerprint is the secret string sitting in a log line where it has no business being. The surface is the dev console now, a log drain in production later.
Where each finding lives in the source
Section titled “Where each finding lives in the source”Now hold the running app beside the source. Each finding lives in one file with its own grep target or DevTools view, so they never pile up in one place. The tree annotates the finding-bearing files plus a couple of seams worth knowing for orientation.
Directorysrc/
- env.ts Sentry env keys land here later (orientation, finding 1)
- proxy.ts the correlation-ID scope lands here later (orientation, finding 3)
Directoryapp/
Directory_components/
- providers.tsx PostHog inits with capturing on, no consent gate (finding 4)
Directory(marketing)/
- page.tsx hero
<Image>missing the eager-load prop (finding 7)
- page.tsx hero
Directory(protected)/
- layout.tsx ~a dozen icons via the
lucide-reactbarrel (finding 6) Directorydashboard/
- page.tsx four reads awaited sequentially (finding 5)
- layout.tsx ~a dozen icons via the
Directoryapi/test/throw/
- route.ts the deliberate-throw proof target (finding 1)
Directorylib/
- logger.ts no redact seam (finding 2), no
requestIdmixin (finding 3)
- logger.ts no redact seam (finding 2), no
Directorydb/queries/
- invoices.ts healthy: already uses the relations API — must stay healthy
- invoices-with-customer.ts 1 + N customer lookups in a loop (finding 8)
Finding 1 is an absence: Sentry’s four config files (instrumentation-client.ts, instrumentation.ts, sentry.server.config.ts, sentry.edge.config.ts) are missing from the tree, and next.config.ts is not wrapped to upload source maps.
The logger’s two findings get fixed together because the same correlation ID has to reach both Pino and Sentry: finding 3 adds a requestId mixin so a log line and its Sentry event share an ID, and finding 2 adds the redaction seam.
The two query files are split to keep the N+1 falsifiable.
If both held the bug, “the codebase has an N+1” would be vague; confined to the invoices-with-customer.ts helper, you can point at the exact query that fires per row, while invoices.ts stays on the relations API as the healthy baseline.
One thing genuinely does not exist yet: there is no consent banner anywhere in the tree. You build it in a later lesson; for now nothing gates PostHog, which is why finding 4 fires on first load.
Write finding 7 end to end
Section titled “Write finding 7 end to end”Fill findings/007-missing-priority.md completely, all five fields: its shape is the template every other finding in this chapter copies, so get it right and the rest are fill-in-the-blanks.
Start at the source. Here is the hero block from the marketing page.
<Image src="/hero.png" alt="Acme dashboard preview" width={1280} height={720} className="w-full max-w-3xl rounded-xl border shadow-sm"/>Identity and accessibility, both present: src points at the hero asset, alt describes it.
The two props you notice first are not the problem.
<Image src="/hero.png" alt="Acme dashboard preview" width={1280} height={720} className="w-full max-w-3xl rounded-xl border shadow-sm"/>Intrinsic dimensions present, so the layout box is reserved before the bytes arrive. That rules out a layout-shift (CLS) bug.
<Image src="/hero.png" alt="Acme dashboard preview" width={1280} height={720} className="w-full max-w-3xl rounded-xl border shadow-sm"/>Now read for what is absent.
No eager-load prop (preload), so the browser treats the hero as lazy-loadable and discovers it only at layout time — the late LCP marker you saw in the trace.
The diagnosis is the trace; the source only confirms which prop is gone.
Now fill the file. Here is the finished findings/007-missing-priority.md, and below it the judgment behind each field.
# Finding 007 — Hero LCP image ships without `preload`
**Category:** LCP / Core Web Vitals (chapter 094, lesson 2).**Severity:** high — the marketing page is the unauthenticated first impression and the route Google Search scores; an LCP regression past the 2.5s threshold costs ranking and conversion on the highest-traffic surface. Not critical because no data is lost and the page renders correctly — it is slow, not broken.
## Rule
The Largest Contentful Paint element gets the eager-load hint exactly once per page so the browser fetches it during document parse instead of discovering it at layout (chapter 094, lesson 2). In Next.js 16 the `next/image` prop is `preload`; `priority` is the deprecated alias for the same behavior. One `preload` per page — a second splits the browser's high-priority budget and neither image lands sooner.
## Location
`src/app/(marketing)/page.tsx`, the hero `<Image>` at lines 21–27: it ships `src`, `alt`, `width={1280}`, and `height={720}` — the CLS-safe dimensions are present — but carries no `preload` (nor the deprecated `priority`), so the browser lazy-loads the LCP element.
Surfaced by the running app: load `/` with the DevTools Performance panel recording — the LCP marker lands on the hero at roughly 4s, and the Network panel shows the hero starting late. Confirm in source with a grep:
    rg -n "<Image" "src/app/(marketing)/page.tsx"
A raw `<img>` would have escaped the grep entirely, which is why the LCP marker is the primary surface and the grep is the source-side confirmation.
## Consequence
The browser does not discover the hero until it computes layout, so the recorded LCP lands near 4s, past the 2.5s "good" threshold at p75. User-visible, with the timing: the headline paints while the largest element — the product screenshot the page is built around — arrives late, so the first impression is a half-rendered page on the slowest connections (mobile, which dominates p75). Google scores LCP at the 75th percentile over a rolling 28-day window, so the regression lags two weeks in the field data and is search-ranking exposure on the most-indexed route.
## Fix
Documented, not patched — the page keeps the defect so the surface stays readable for the chapter. Three layers:
1. Add `preload` to the hero `<Image>`, the one LCP element. This moves its fetch to document-parse time and is the load-bearing fix.2. Add the `@next/next/no-img-element` lint rule at error as a regression guard, so a future raw `<img>` can't reintroduce the problem (it lives in `eslint-config-next/core-web-vitals`).3. Keep `width`/`height` (already present) as the separate CLS layer — `preload` speeds the fetch but unsized media still shifts layout, so the LCP element needs both.
Read the doc for the text; here is the decision rule behind each field, the part that does not show on the page.
- Severity is the line between two grades: slow is high, broken or leaking is critical. This page is slow on the surface Search ranks, so high.
- Rule names the current prop. Writing
preload, not the deprecatedpriority, is what separates someone who read the Next.js 16 docs from someone repeating an old tutorial. Cite the owning lesson instead of re-explaining the theory. - Location leads with the surface that re-runs: the DevTools LCP marker, so the next reader watches the same fingerprint appear. The grep is secondary, because a raw
<img>would not match<Imageand you could miss the defect. - Consequence is stated in user-visible terms with a number — LCP near 4s past the 2.5s p75 threshold — plus the second-order cost most people miss: Search scores p75 over a rolling 28-day window, so a regression costs rankings two weeks before it shows in your field data.
- Fix earns full credit only by naming all three orthogonal layers:
preloadonce on the hero, the@next/next/no-img-elementlint rule as a regression guard, andwidth/heightas the CLS layerpreloaddoes nothing for. Half-credit names the prop and stops.
You document this finding and leave the defect in place: the marketing page keeps shipping without preload for the rest of the chapter, so every later lesson can still open / and watch the same late LCP marker.
Performance findings are documented; only the observability findings get wired.
Two rules for the rest of the chapter
Section titled “Two rules for the rest of the chapter”First: observability findings get fixed, performance findings get documented.
You wire findings 1 through 4 in later lessons, so each Fix section will name the seam you installed and the call sites it now governs, not show a snippet like finding 7’s.
Leave 001 through 004 empty until you close them.
Second: read the trace before the source on performance findings.
The source looks fine on its own: the awaits look ordinary, the <Image> looks complete, the query loop reads like normal code.
The defect shows up only in the shape of the running behavior, the staircase, the late marker, the 1+N query count.
Read the source first and you will rationalize it as correct and never open the trace.
A self-check before you move on:
findings/007-missing-priority.md carries all five fields: Category, Severity, and the four template sections.<Image> at lines 21–27 and the DevTools Performance LCP marker that surfaced it.preload, the no-img-element lint guard, and width/height as the separate CLS layer.The next lesson stops documenting and starts wiring: you install Sentry so that deliberate throw you watched vanish lands in a dashboard, decoded.
External resources
Section titled “External resources”The canonical sources behind finding 7’s judgment, plus the docs for the panel the whole audit drives from.
web.dev's actionable LCP guide — the four subparts and why eager-loading the LCP resource is the load-bearing fix.
The Next.js 16 Image API — the priority/preload prop the finding 7 fix names, plus width/height as the CLS layer.
The metric reference behind the Consequence section — the 2.5s threshold and the p75 field scoring.
Chrome DevTools docs for the panel the audit drives from — recording traces, the LCP marker, and the flame chart.