Document the performance findings
The observability half of the audit is wired. Those gaps got fixed because they lose data, and lost data cannot be recovered after launch.
The performance half is different. The dashboard waterfall, the lucide-react barrel, and the N+1 in the invoice helper lose nothing: they render correct data, just heavier or later. A finding like that is slow, not bleeding, so you document it with measured impact and send it to the backlog instead of patching it on the spot. The one exception is the barrel import, which you fix in place to capture before-and-after evidence from the bundle analyzer.
Your mission
Section titled “Your mission”Write the performance half of a launch-review audit report. Each finding names four things: the rule it violates (with the chapter 094 lesson that owns it), the location in source plus the diagnostic surface that exposed it, the consequence in operator- or user-visible terms, and the fix. Finding 7 is the template; you fill three more files to the same shape.
The contract is document, don’t patch: the deliverable is findings, not code changes. The one exception is the barrel import, which you fix in next.config.ts because the bundle-analyzer treemap before and after is the required evidence. Every other defect stays in source.
findings/005-rsc-waterfall.md carries all four template sections, cites the chapter 094 lesson 6 RSC-waterfall rule, locates the defect in src/app/(protected)/dashboard/page.tsx, and names the fix as parallelizing the independent invoices-and-members pair only.findings/006-barrel-import.md carries all four sections, cites the chapter 094 lessons 3/4 barrel-and-analyzer rule, locates it in src/app/(protected)/layout.tsx and next.config.ts, names the optimizePackageImports fix, and embeds both screenshots/before-barrel.png and screenshots/after-barrel.png.findings/008-n-plus-1-invoices.md carries all four sections, cites the chapter 094 lesson 7 N+1 rule, locates it in src/db/queries/invoices-with-customer.ts, and names the relations-API fix (findMany({ with: { customer: true } })) verified with .toSQL().next.config.ts lists lucide-react under experimental.optimizePackageImports — the one in-place performance fix.pnpm next experimental-analyze runs — before the config edit, then after — showing the lucide-react tile collapse.findings/SUMMARY.md states coverage (the 8/8 floor plus any bonuses), names the audit cadence, and pastes the final analyzer treemap as secondary evidence.findings/out-of-scope.md records the deliberate cuts — deferred fixes logged as backlog, observations outside the eight categories.findings/010-composite-index.md names the missing composite index, proven with EXPLAIN ANALYZE, with the fix as declare-in-schema plus a generated drizzle-kit migration — naming the index without generating the migration is half-credit.Coding time
Section titled “Coding time”Write the three findings, the one config line, SUMMARY.md, out-of-scope.md, and the optional bonus now, against the brief above and the lesson’s tests. Read the running surface first, confirm in source, then fill each file to the template. The reference solution follows for after your attempt.
Reference solution and walkthrough
Finding 005 — the dashboard RSC waterfall
Section titled “Finding 005 — the dashboard RSC waterfall”The dashboard awaits four reads back to back:
// user → org is a genuine dependency: the orgId comes from the session.const { user, orgId } = await requireOrgUser();const org = await getOrganization(orgId);
// SEEDED #5: these two are independent but awaited sequentially (the waterfall).const invoices = await listInvoicesWithCustomer({ orgId });const members = await listMembers(orgId);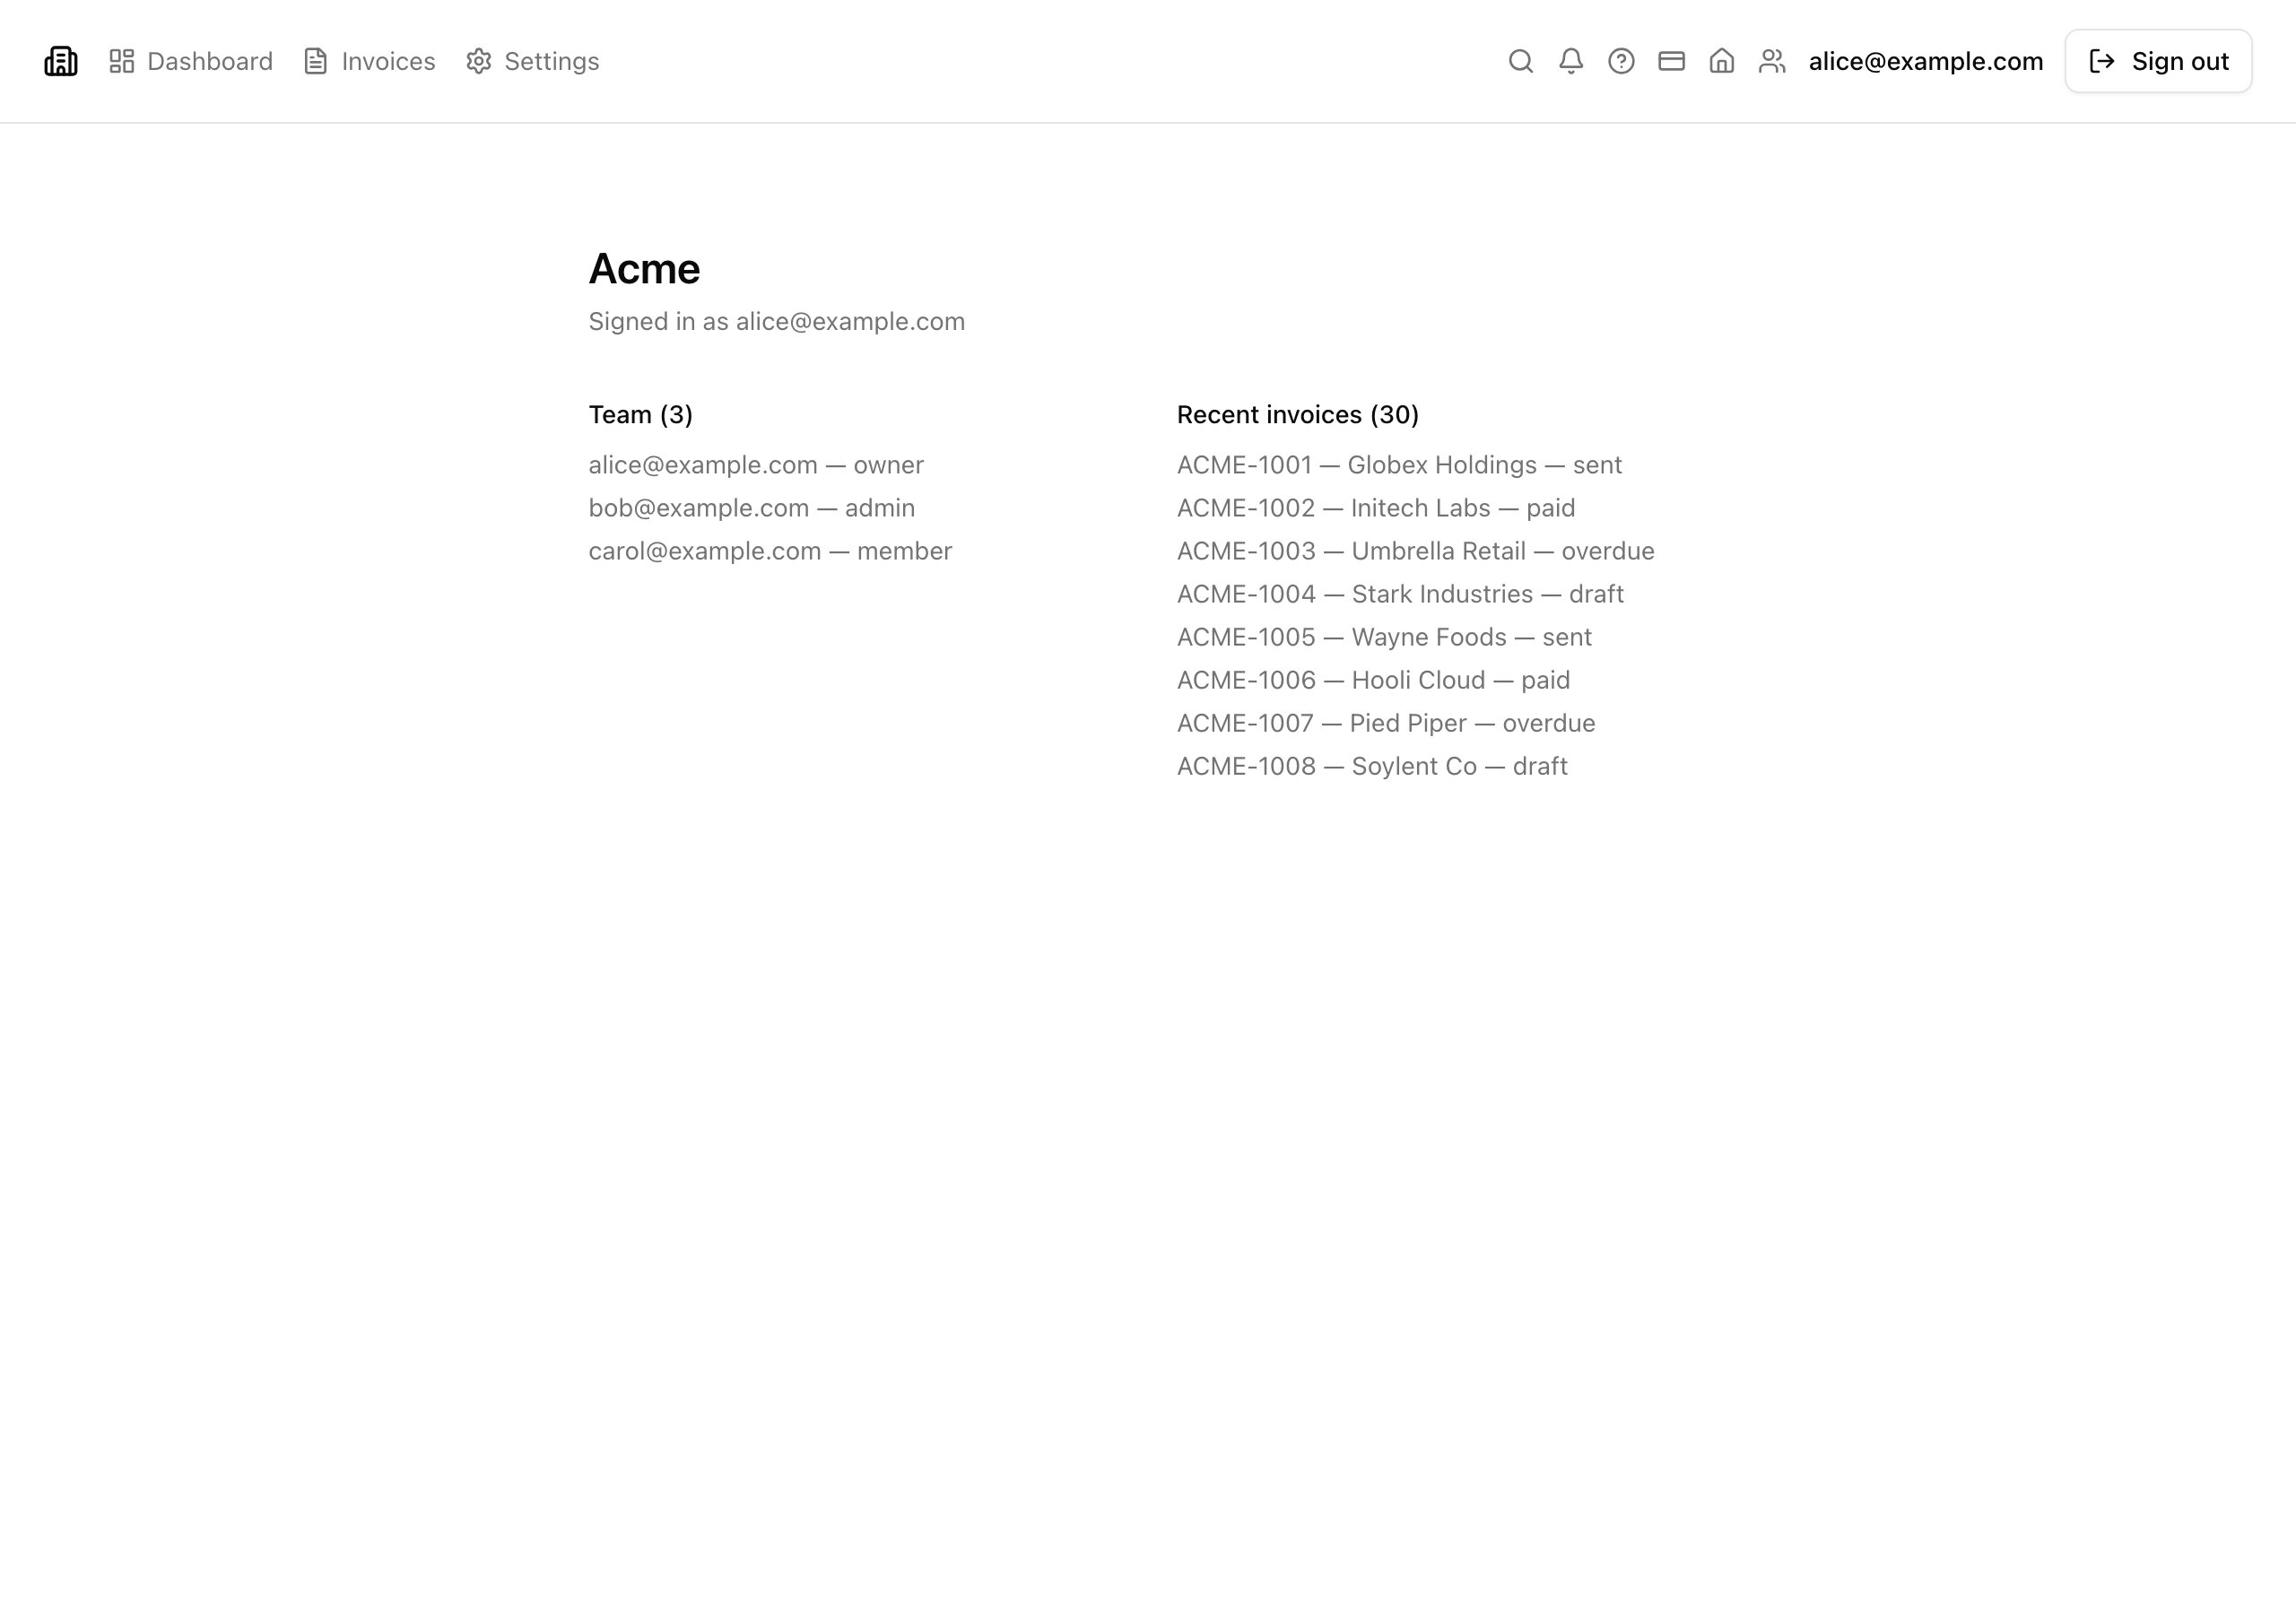
# Finding 005 — Dashboard RSC waterfall: four sequential awaits, two of them independent
**Category:** RSC waterfall (chapter 094, lesson 6).**Severity:** medium — the page renders correct data and nothing is lost; the cost is render latency on the authenticated landing surface, roughly a third of it avoidable. Medium, not high: it is a measurable slow path the operator sees in a trace, not a user-facing breakage, and the fix is one line.
## Rule
Run the dependency-check before every `await` in a Server Component: two reads that don't consume each other's result must not block in sequence (chapter 094, lesson 6 — `RSC waterfalls and the dependency-check reflex`). Independent reads parallelize with `Promise.all`; only a genuine data dependency (B needs A's output) stays sequential.
## Location
`src/app/(protected)/dashboard/page.tsx`, lines 16–23 — the component awaits four reads back to back:
```requireOrgUser() → getOrganization(orgId) → listInvoicesWithCustomer({ orgId }) → listMembers(orgId)```
`user → org` is a real dependency: `orgId` comes from the session, so `getOrganization` can't start until `requireOrgUser` resolves. But `listInvoicesWithCustomer` and `listMembers` both take only `orgId` and neither reads the other's result — they are independent, yet the second `await` blocks on the first.
How it surfaced — read the running app first, then confirm in source. Load `/dashboard` as the seeded admin with the Chrome DevTools Performance panel (or a Sentry trace) recording. The trace shows a **staircase**: four spans laid end to end with idle gaps between them, the invoices span and the members span sitting one after the other instead of overlapping. Then confirm in source with a grep:
```rg -n "await " "src/app/(protected)/dashboard/page.tsx"```
The four `await`s on consecutive lines are the fingerprint; the trace is what makes the wasted span visible before you ever open the file.
## Consequence
The page takes the **sum** of four round-trips when the sum of three is reachable. With the seeded data the render lands around 320ms where roughly 240ms is achievable — the invoices read (~80ms over the seeded ≥30 rows) and the members read (~40ms) run nose to tail instead of overlapping, so the cheaper of the two is pure dead time on the critical path. Operator-visible as a slow authenticated landing: the dashboard is the first screen every signed-in user hits, the latency compounds with the N+1 in finding 8 (the invoices span is itself inflated), and the gap widens as either list grows.
## Fix
Documented, not patched — the page keeps the sequential body so the staircase stays readable for the lesson. The senior reach parallelizes **only the independent pair**:
```tsxconst { user, orgId } = await requireOrgUser();const org = await getOrganization(orgId);
// Independent of each other — both depend only on orgId, so start them together.const [invoices, members] = await Promise.all([  listInvoicesWithCustomer({ orgId }),  listMembers(orgId),]);```
`user → org` stays sequential — `org` genuinely needs `orgId`, and wrapping it into the `Promise.all` would be the "wrap everything" anti-pattern that breaks the dependency. The discipline is to ask "does this await consume the previous result?" at each one and parallelize only where the answer is no. For request-scoped dedup of a read called from more than one place, React `cache()` is the companion tool (not `unstable_cache`) — not needed here, but named as the next reach.
Half-credit wraps all four reads in one `Promise.all` (it parallelizes the independent pair but breaks the `user → org` dependency, or relies on luck); full credit parallelizes the invoices/members pair only and leaves `user → org` sequential.
Category (RSC waterfall, chapter 094 lesson 6) and Severity with a two-line justification.
# Finding 005 — Dashboard RSC waterfall: four sequential awaits, two of them independent
**Category:** RSC waterfall (chapter 094, lesson 6).**Severity:** medium — the page renders correct data and nothing is lost; the cost is render latency on the authenticated landing surface, roughly a third of it avoidable. Medium, not high: it is a measurable slow path the operator sees in a trace, not a user-facing breakage, and the fix is one line.
## Rule
Run the dependency-check before every `await` in a Server Component: two reads that don't consume each other's result must not block in sequence (chapter 094, lesson 6 — `RSC waterfalls and the dependency-check reflex`). Independent reads parallelize with `Promise.all`; only a genuine data dependency (B needs A's output) stays sequential.
## Location
`src/app/(protected)/dashboard/page.tsx`, lines 16–23 — the component awaits four reads back to back:
```requireOrgUser() → getOrganization(orgId) → listInvoicesWithCustomer({ orgId }) → listMembers(orgId)```
`user → org` is a real dependency: `orgId` comes from the session, so `getOrganization` can't start until `requireOrgUser` resolves. But `listInvoicesWithCustomer` and `listMembers` both take only `orgId` and neither reads the other's result — they are independent, yet the second `await` blocks on the first.
How it surfaced — read the running app first, then confirm in source. Load `/dashboard` as the seeded admin with the Chrome DevTools Performance panel (or a Sentry trace) recording. The trace shows a **staircase**: four spans laid end to end with idle gaps between them, the invoices span and the members span sitting one after the other instead of overlapping. Then confirm in source with a grep:
```rg -n "await " "src/app/(protected)/dashboard/page.tsx"```
The four `await`s on consecutive lines are the fingerprint; the trace is what makes the wasted span visible before you ever open the file.
## Consequence
The page takes the **sum** of four round-trips when the sum of three is reachable. With the seeded data the render lands around 320ms where roughly 240ms is achievable — the invoices read (~80ms over the seeded ≥30 rows) and the members read (~40ms) run nose to tail instead of overlapping, so the cheaper of the two is pure dead time on the critical path. Operator-visible as a slow authenticated landing: the dashboard is the first screen every signed-in user hits, the latency compounds with the N+1 in finding 8 (the invoices span is itself inflated), and the gap widens as either list grows.
## Fix
Documented, not patched — the page keeps the sequential body so the staircase stays readable for the lesson. The senior reach parallelizes **only the independent pair**:
```tsxconst { user, orgId } = await requireOrgUser();const org = await getOrganization(orgId);
// Independent of each other — both depend only on orgId, so start them together.const [invoices, members] = await Promise.all([  listInvoicesWithCustomer({ orgId }),  listMembers(orgId),]);```
`user → org` stays sequential — `org` genuinely needs `orgId`, and wrapping it into the `Promise.all` would be the "wrap everything" anti-pattern that breaks the dependency. The discipline is to ask "does this await consume the previous result?" at each one and parallelize only where the answer is no. For request-scoped dedup of a read called from more than one place, React `cache()` is the companion tool (not `unstable_cache`) — not needed here, but named as the next reach.
Half-credit wraps all four reads in one `Promise.all` (it parallelizes the independent pair but breaks the `user → org` dependency, or relies on luck); full credit parallelizes the invoices/members pair only and leaves `user → org` sequential.
Rule. The dependency-check before every await: independent reads parallelize, a genuine data dependency stays sequential.
# Finding 005 — Dashboard RSC waterfall: four sequential awaits, two of them independent
**Category:** RSC waterfall (chapter 094, lesson 6).**Severity:** medium — the page renders correct data and nothing is lost; the cost is render latency on the authenticated landing surface, roughly a third of it avoidable. Medium, not high: it is a measurable slow path the operator sees in a trace, not a user-facing breakage, and the fix is one line.
## Rule
Run the dependency-check before every `await` in a Server Component: two reads that don't consume each other's result must not block in sequence (chapter 094, lesson 6 — `RSC waterfalls and the dependency-check reflex`). Independent reads parallelize with `Promise.all`; only a genuine data dependency (B needs A's output) stays sequential.
## Location
`src/app/(protected)/dashboard/page.tsx`, lines 16–23 — the component awaits four reads back to back:
```requireOrgUser() → getOrganization(orgId) → listInvoicesWithCustomer({ orgId }) → listMembers(orgId)```
`user → org` is a real dependency: `orgId` comes from the session, so `getOrganization` can't start until `requireOrgUser` resolves. But `listInvoicesWithCustomer` and `listMembers` both take only `orgId` and neither reads the other's result — they are independent, yet the second `await` blocks on the first.
How it surfaced — read the running app first, then confirm in source. Load `/dashboard` as the seeded admin with the Chrome DevTools Performance panel (or a Sentry trace) recording. The trace shows a **staircase**: four spans laid end to end with idle gaps between them, the invoices span and the members span sitting one after the other instead of overlapping. Then confirm in source with a grep:
```rg -n "await " "src/app/(protected)/dashboard/page.tsx"```
The four `await`s on consecutive lines are the fingerprint; the trace is what makes the wasted span visible before you ever open the file.
## Consequence
The page takes the **sum** of four round-trips when the sum of three is reachable. With the seeded data the render lands around 320ms where roughly 240ms is achievable — the invoices read (~80ms over the seeded ≥30 rows) and the members read (~40ms) run nose to tail instead of overlapping, so the cheaper of the two is pure dead time on the critical path. Operator-visible as a slow authenticated landing: the dashboard is the first screen every signed-in user hits, the latency compounds with the N+1 in finding 8 (the invoices span is itself inflated), and the gap widens as either list grows.
## Fix
Documented, not patched — the page keeps the sequential body so the staircase stays readable for the lesson. The senior reach parallelizes **only the independent pair**:
```tsxconst { user, orgId } = await requireOrgUser();const org = await getOrganization(orgId);
// Independent of each other — both depend only on orgId, so start them together.const [invoices, members] = await Promise.all([  listInvoicesWithCustomer({ orgId }),  listMembers(orgId),]);```
`user → org` stays sequential — `org` genuinely needs `orgId`, and wrapping it into the `Promise.all` would be the "wrap everything" anti-pattern that breaks the dependency. The discipline is to ask "does this await consume the previous result?" at each one and parallelize only where the answer is no. For request-scoped dedup of a read called from more than one place, React `cache()` is the companion tool (not `unstable_cache`) — not needed here, but named as the next reach.
Half-credit wraps all four reads in one `Promise.all` (it parallelizes the independent pair but breaks the `user → org` dependency, or relies on luck); full credit parallelizes the invoices/members pair only and leaves `user → org` sequential.
Location. The four-await chain, surfaced by the DevTools trace staircase then confirmed with rg: surface first, source second.
# Finding 005 — Dashboard RSC waterfall: four sequential awaits, two of them independent
**Category:** RSC waterfall (chapter 094, lesson 6).**Severity:** medium — the page renders correct data and nothing is lost; the cost is render latency on the authenticated landing surface, roughly a third of it avoidable. Medium, not high: it is a measurable slow path the operator sees in a trace, not a user-facing breakage, and the fix is one line.
## Rule
Run the dependency-check before every `await` in a Server Component: two reads that don't consume each other's result must not block in sequence (chapter 094, lesson 6 — `RSC waterfalls and the dependency-check reflex`). Independent reads parallelize with `Promise.all`; only a genuine data dependency (B needs A's output) stays sequential.
## Location
`src/app/(protected)/dashboard/page.tsx`, lines 16–23 — the component awaits four reads back to back:
```requireOrgUser() → getOrganization(orgId) → listInvoicesWithCustomer({ orgId }) → listMembers(orgId)```
`user → org` is a real dependency: `orgId` comes from the session, so `getOrganization` can't start until `requireOrgUser` resolves. But `listInvoicesWithCustomer` and `listMembers` both take only `orgId` and neither reads the other's result — they are independent, yet the second `await` blocks on the first.
How it surfaced — read the running app first, then confirm in source. Load `/dashboard` as the seeded admin with the Chrome DevTools Performance panel (or a Sentry trace) recording. The trace shows a **staircase**: four spans laid end to end with idle gaps between them, the invoices span and the members span sitting one after the other instead of overlapping. Then confirm in source with a grep:
```rg -n "await " "src/app/(protected)/dashboard/page.tsx"```
The four `await`s on consecutive lines are the fingerprint; the trace is what makes the wasted span visible before you ever open the file.
## Consequence
The page takes the **sum** of four round-trips when the sum of three is reachable. With the seeded data the render lands around 320ms where roughly 240ms is achievable — the invoices read (~80ms over the seeded ≥30 rows) and the members read (~40ms) run nose to tail instead of overlapping, so the cheaper of the two is pure dead time on the critical path. Operator-visible as a slow authenticated landing: the dashboard is the first screen every signed-in user hits, the latency compounds with the N+1 in finding 8 (the invoices span is itself inflated), and the gap widens as either list grows.
## Fix
Documented, not patched — the page keeps the sequential body so the staircase stays readable for the lesson. The senior reach parallelizes **only the independent pair**:
```tsxconst { user, orgId } = await requireOrgUser();const org = await getOrganization(orgId);
// Independent of each other — both depend only on orgId, so start them together.const [invoices, members] = await Promise.all([  listInvoicesWithCustomer({ orgId }),  listMembers(orgId),]);```
`user → org` stays sequential — `org` genuinely needs `orgId`, and wrapping it into the `Promise.all` would be the "wrap everything" anti-pattern that breaks the dependency. The discipline is to ask "does this await consume the previous result?" at each one and parallelize only where the answer is no. For request-scoped dedup of a read called from more than one place, React `cache()` is the companion tool (not `unstable_cache`) — not needed here, but named as the next reach.
Half-credit wraps all four reads in one `Promise.all` (it parallelizes the independent pair but breaks the `user → org` dependency, or relies on luck); full credit parallelizes the invoices/members pair only and leaves `user → org` sequential.
Consequence. Operator-visible timing: ~320ms where ~240ms is reachable, the members read sitting as dead time.
# Finding 005 — Dashboard RSC waterfall: four sequential awaits, two of them independent
**Category:** RSC waterfall (chapter 094, lesson 6).**Severity:** medium — the page renders correct data and nothing is lost; the cost is render latency on the authenticated landing surface, roughly a third of it avoidable. Medium, not high: it is a measurable slow path the operator sees in a trace, not a user-facing breakage, and the fix is one line.
## Rule
Run the dependency-check before every `await` in a Server Component: two reads that don't consume each other's result must not block in sequence (chapter 094, lesson 6 — `RSC waterfalls and the dependency-check reflex`). Independent reads parallelize with `Promise.all`; only a genuine data dependency (B needs A's output) stays sequential.
## Location
`src/app/(protected)/dashboard/page.tsx`, lines 16–23 — the component awaits four reads back to back:
```requireOrgUser() → getOrganization(orgId) → listInvoicesWithCustomer({ orgId }) → listMembers(orgId)```
`user → org` is a real dependency: `orgId` comes from the session, so `getOrganization` can't start until `requireOrgUser` resolves. But `listInvoicesWithCustomer` and `listMembers` both take only `orgId` and neither reads the other's result — they are independent, yet the second `await` blocks on the first.
How it surfaced — read the running app first, then confirm in source. Load `/dashboard` as the seeded admin with the Chrome DevTools Performance panel (or a Sentry trace) recording. The trace shows a **staircase**: four spans laid end to end with idle gaps between them, the invoices span and the members span sitting one after the other instead of overlapping. Then confirm in source with a grep:
```rg -n "await " "src/app/(protected)/dashboard/page.tsx"```
The four `await`s on consecutive lines are the fingerprint; the trace is what makes the wasted span visible before you ever open the file.
## Consequence
The page takes the **sum** of four round-trips when the sum of three is reachable. With the seeded data the render lands around 320ms where roughly 240ms is achievable — the invoices read (~80ms over the seeded ≥30 rows) and the members read (~40ms) run nose to tail instead of overlapping, so the cheaper of the two is pure dead time on the critical path. Operator-visible as a slow authenticated landing: the dashboard is the first screen every signed-in user hits, the latency compounds with the N+1 in finding 8 (the invoices span is itself inflated), and the gap widens as either list grows.
## Fix
Documented, not patched — the page keeps the sequential body so the staircase stays readable for the lesson. The senior reach parallelizes **only the independent pair**:
```tsxconst { user, orgId } = await requireOrgUser();const org = await getOrganization(orgId);
// Independent of each other — both depend only on orgId, so start them together.const [invoices, members] = await Promise.all([  listInvoicesWithCustomer({ orgId }),  listMembers(orgId),]);```
`user → org` stays sequential — `org` genuinely needs `orgId`, and wrapping it into the `Promise.all` would be the "wrap everything" anti-pattern that breaks the dependency. The discipline is to ask "does this await consume the previous result?" at each one and parallelize only where the answer is no. For request-scoped dedup of a read called from more than one place, React `cache()` is the companion tool (not `unstable_cache`) — not needed here, but named as the next reach.
Half-credit wraps all four reads in one `Promise.all` (it parallelizes the independent pair but breaks the `user → org` dependency, or relies on luck); full credit parallelizes the invoices/members pair only and leaves `user → org` sequential.
Fix. The Promise.all wraps the independent invoices+members pair only; user → org stays sequential. Wrapping all four is the half-credit trap.
For the full diagnosis-and-rewrite treatment, see RSC waterfalls and Promise.all.
Finding 006 — the lucide-react barrel import
Section titled “Finding 006 — the lucide-react barrel import”The protected layout opens with a barrel import of about a dozen icons:
import { Bell, Building2, CreditCard, FileText, HelpCircle, Home, LayoutDashboard, LogOut, Search, Settings, Users,} from 'lucide-react';# Finding 006 — `lucide-react` barrel import ships the whole icon set on every authenticated page
**Category:** Bundle size — the barrel-export trap + the Turbopack analyzer (chapter 094, lessons 3/4).**Severity:** high — the cost rides on the `(protected)` layout, so it lands on *every* authenticated page, and it is JavaScript the client must parse and execute before the nav is interactive (INP risk on slow mobile). Not critical because the page renders correctly and the fix is one config line, but it is the heaviest single avoidable weight in the authenticated bundle.
## Rule
A barrel import (`import { Home, FileText } from 'lucide-react'`) pulls the package's entire entry module — and therefore every re-exported icon — into the bundle when the bundler can't tree-shake it, so the build must be told to rewrite the import to per-icon module paths (chapter 094, lessons 3/4 — `the barrel-export trap` and `the Turbopack analyzer`). `experimental.optimizePackageImports` is the team-level seam: one config entry rewrites every barrel import of that package across the app, with no churn at the call sites.
## Location
- `src/app/(protected)/layout.tsx`, lines 1–13 — the nav imports ~a dozen icons (`Bell`, `Building2`, `CreditCard`, `FileText`, `HelpCircle`, `Home`, `LayoutDashboard`, `LogOut`, `Search`, `Settings`, `Users`) from the `lucide-react` **barrel**.- `next.config.ts` — the missing list entry: `lucide-react` was absent from `experimental.optimizePackageImports`, so nothing rewrote the barrel.
How it surfaced — the diagnostic surface is the analyzer treemap, not source. Run the Turbopack analyzer and open the report:
```pnpm next experimental-analyze```
It writes the treemap under `.next/diagnostics/analyze`. **Before** the fix a single `lucide-react` tile dominates the authenticated route's client bundle at roughly 600 KB — the whole icon set, not the dozen glyphs the nav uses. That oversized tile is the fingerprint; the grep below confirms the missing config entry:
```rg -n "optimizePackageImports" next.config.ts```
## Consequence
Roughly **570 KB** of icon code the app never renders ships on every authenticated page — the dozen used glyphs are a few KB, the rest is dead weight the browser still downloads, parses, and executes. Operator- and user-visible: a heavier main-thread parse before the nav is interactive, which shows up as INP regression on slow mobile devices (the budget is INP ≤ 200ms at p75), and wasted bytes on every authenticated navigation. Because the import lives in the shared `(protected)` layout, the cost is multiplied across the whole authenticated surface, not isolated to one route.
## Fix
This is the one in-place performance fix in the audit (slice S5) — the line is added to `next.config.ts`:
```tsexperimental: { optimizePackageImports: ['lucide-react'] },```
The seam rewrites every `lucide-react` barrel import to its per-icon module path at build, so only the referenced glyphs reach the bundle — the call sites in `layout.tsx` are untouched. This is the senior default over hand-converting each import to `lucide-react/dist/esm/icons/<icon>` per icon: per-icon imports work but are churn the next icon addition re-introduces, while the config entry is the single place the rule is configured (the "one seam" pattern). For an internal package the team owns, `sideEffects: false` in its `package.json` is the complementary lever — it tells the bundler the modules are tree-shakeable so a barrel re-export drops unused exports without needing `optimizePackageImports` at all.
After the fix, re-run `pnpm next experimental-analyze` and compare the treemap: the `lucide-react` tile collapses to the handful of used icons.
**Before / after the fix (the analyzer treemap, captured by the by-hand analyzer run):**


Half-credit converts the call sites to per-icon imports (it shrinks the bundle but is per-call-site churn); full credit names `optimizePackageImports` as the single seam, with `sideEffects: false` as the internal-package companion.Category (bundle size — the barrel trap + the Turbopack analyzer, chapter 094 lessons 3/4) and Severity high: every authenticated page pays the weight.
# Finding 006 — `lucide-react` barrel import ships the whole icon set on every authenticated page
**Category:** Bundle size — the barrel-export trap + the Turbopack analyzer (chapter 094, lessons 3/4).**Severity:** high — the cost rides on the `(protected)` layout, so it lands on *every* authenticated page, and it is JavaScript the client must parse and execute before the nav is interactive (INP risk on slow mobile). Not critical because the page renders correctly and the fix is one config line, but it is the heaviest single avoidable weight in the authenticated bundle.
## Rule
A barrel import (`import { Home, FileText } from 'lucide-react'`) pulls the package's entire entry module — and therefore every re-exported icon — into the bundle when the bundler can't tree-shake it, so the build must be told to rewrite the import to per-icon module paths (chapter 094, lessons 3/4 — `the barrel-export trap` and `the Turbopack analyzer`). `experimental.optimizePackageImports` is the team-level seam: one config entry rewrites every barrel import of that package across the app, with no churn at the call sites.
## Location
- `src/app/(protected)/layout.tsx`, lines 1–13 — the nav imports ~a dozen icons (`Bell`, `Building2`, `CreditCard`, `FileText`, `HelpCircle`, `Home`, `LayoutDashboard`, `LogOut`, `Search`, `Settings`, `Users`) from the `lucide-react` **barrel**.- `next.config.ts` — the missing list entry: `lucide-react` was absent from `experimental.optimizePackageImports`, so nothing rewrote the barrel.
How it surfaced — the diagnostic surface is the analyzer treemap, not source. Run the Turbopack analyzer and open the report:
```pnpm next experimental-analyze```
It writes the treemap under `.next/diagnostics/analyze`. **Before** the fix a single `lucide-react` tile dominates the authenticated route's client bundle at roughly 600 KB — the whole icon set, not the dozen glyphs the nav uses. That oversized tile is the fingerprint; the grep below confirms the missing config entry:
```rg -n "optimizePackageImports" next.config.ts```
## Consequence
Roughly **570 KB** of icon code the app never renders ships on every authenticated page — the dozen used glyphs are a few KB, the rest is dead weight the browser still downloads, parses, and executes. Operator- and user-visible: a heavier main-thread parse before the nav is interactive, which shows up as INP regression on slow mobile devices (the budget is INP ≤ 200ms at p75), and wasted bytes on every authenticated navigation. Because the import lives in the shared `(protected)` layout, the cost is multiplied across the whole authenticated surface, not isolated to one route.
## Fix
This is the one in-place performance fix in the audit (slice S5) — the line is added to `next.config.ts`:
```tsexperimental: { optimizePackageImports: ['lucide-react'] },```
The seam rewrites every `lucide-react` barrel import to its per-icon module path at build, so only the referenced glyphs reach the bundle — the call sites in `layout.tsx` are untouched. This is the senior default over hand-converting each import to `lucide-react/dist/esm/icons/<icon>` per icon: per-icon imports work but are churn the next icon addition re-introduces, while the config entry is the single place the rule is configured (the "one seam" pattern). For an internal package the team owns, `sideEffects: false` in its `package.json` is the complementary lever — it tells the bundler the modules are tree-shakeable so a barrel re-export drops unused exports without needing `optimizePackageImports` at all.
After the fix, re-run `pnpm next experimental-analyze` and compare the treemap: the `lucide-react` tile collapses to the handful of used icons.
**Before / after the fix (the analyzer treemap, captured by the by-hand analyzer run):**


Half-credit converts the call sites to per-icon imports (it shrinks the bundle but is per-call-site churn); full credit names `optimizePackageImports` as the single seam, with `sideEffects: false` as the internal-package companion.Rule. A barrel import pulls the package’s whole entry module; optimizePackageImports is the team-level seam that rewrites it with no call-site churn.
# Finding 006 — `lucide-react` barrel import ships the whole icon set on every authenticated page
**Category:** Bundle size — the barrel-export trap + the Turbopack analyzer (chapter 094, lessons 3/4).**Severity:** high — the cost rides on the `(protected)` layout, so it lands on *every* authenticated page, and it is JavaScript the client must parse and execute before the nav is interactive (INP risk on slow mobile). Not critical because the page renders correctly and the fix is one config line, but it is the heaviest single avoidable weight in the authenticated bundle.
## Rule
A barrel import (`import { Home, FileText } from 'lucide-react'`) pulls the package's entire entry module — and therefore every re-exported icon — into the bundle when the bundler can't tree-shake it, so the build must be told to rewrite the import to per-icon module paths (chapter 094, lessons 3/4 — `the barrel-export trap` and `the Turbopack analyzer`). `experimental.optimizePackageImports` is the team-level seam: one config entry rewrites every barrel import of that package across the app, with no churn at the call sites.
## Location
- `src/app/(protected)/layout.tsx`, lines 1–13 — the nav imports ~a dozen icons (`Bell`, `Building2`, `CreditCard`, `FileText`, `HelpCircle`, `Home`, `LayoutDashboard`, `LogOut`, `Search`, `Settings`, `Users`) from the `lucide-react` **barrel**.- `next.config.ts` — the missing list entry: `lucide-react` was absent from `experimental.optimizePackageImports`, so nothing rewrote the barrel.
How it surfaced — the diagnostic surface is the analyzer treemap, not source. Run the Turbopack analyzer and open the report:
```pnpm next experimental-analyze```
It writes the treemap under `.next/diagnostics/analyze`. **Before** the fix a single `lucide-react` tile dominates the authenticated route's client bundle at roughly 600 KB — the whole icon set, not the dozen glyphs the nav uses. That oversized tile is the fingerprint; the grep below confirms the missing config entry:
```rg -n "optimizePackageImports" next.config.ts```
## Consequence
Roughly **570 KB** of icon code the app never renders ships on every authenticated page — the dozen used glyphs are a few KB, the rest is dead weight the browser still downloads, parses, and executes. Operator- and user-visible: a heavier main-thread parse before the nav is interactive, which shows up as INP regression on slow mobile devices (the budget is INP ≤ 200ms at p75), and wasted bytes on every authenticated navigation. Because the import lives in the shared `(protected)` layout, the cost is multiplied across the whole authenticated surface, not isolated to one route.
## Fix
This is the one in-place performance fix in the audit (slice S5) — the line is added to `next.config.ts`:
```tsexperimental: { optimizePackageImports: ['lucide-react'] },```
The seam rewrites every `lucide-react` barrel import to its per-icon module path at build, so only the referenced glyphs reach the bundle — the call sites in `layout.tsx` are untouched. This is the senior default over hand-converting each import to `lucide-react/dist/esm/icons/<icon>` per icon: per-icon imports work but are churn the next icon addition re-introduces, while the config entry is the single place the rule is configured (the "one seam" pattern). For an internal package the team owns, `sideEffects: false` in its `package.json` is the complementary lever — it tells the bundler the modules are tree-shakeable so a barrel re-export drops unused exports without needing `optimizePackageImports` at all.
After the fix, re-run `pnpm next experimental-analyze` and compare the treemap: the `lucide-react` tile collapses to the handful of used icons.
**Before / after the fix (the analyzer treemap, captured by the by-hand analyzer run):**


Half-credit converts the call sites to per-icon imports (it shrinks the bundle but is per-call-site churn); full credit names `optimizePackageImports` as the single seam, with `sideEffects: false` as the internal-package companion.Location. layout.tsx plus the missing next.config.ts entry, surfaced by the oversized lucide-react tile in the analyzer treemap, not a grep target.
# Finding 006 — `lucide-react` barrel import ships the whole icon set on every authenticated page
**Category:** Bundle size — the barrel-export trap + the Turbopack analyzer (chapter 094, lessons 3/4).**Severity:** high — the cost rides on the `(protected)` layout, so it lands on *every* authenticated page, and it is JavaScript the client must parse and execute before the nav is interactive (INP risk on slow mobile). Not critical because the page renders correctly and the fix is one config line, but it is the heaviest single avoidable weight in the authenticated bundle.
## Rule
A barrel import (`import { Home, FileText } from 'lucide-react'`) pulls the package's entire entry module — and therefore every re-exported icon — into the bundle when the bundler can't tree-shake it, so the build must be told to rewrite the import to per-icon module paths (chapter 094, lessons 3/4 — `the barrel-export trap` and `the Turbopack analyzer`). `experimental.optimizePackageImports` is the team-level seam: one config entry rewrites every barrel import of that package across the app, with no churn at the call sites.
## Location
- `src/app/(protected)/layout.tsx`, lines 1–13 — the nav imports ~a dozen icons (`Bell`, `Building2`, `CreditCard`, `FileText`, `HelpCircle`, `Home`, `LayoutDashboard`, `LogOut`, `Search`, `Settings`, `Users`) from the `lucide-react` **barrel**.- `next.config.ts` — the missing list entry: `lucide-react` was absent from `experimental.optimizePackageImports`, so nothing rewrote the barrel.
How it surfaced — the diagnostic surface is the analyzer treemap, not source. Run the Turbopack analyzer and open the report:
```pnpm next experimental-analyze```
It writes the treemap under `.next/diagnostics/analyze`. **Before** the fix a single `lucide-react` tile dominates the authenticated route's client bundle at roughly 600 KB — the whole icon set, not the dozen glyphs the nav uses. That oversized tile is the fingerprint; the grep below confirms the missing config entry:
```rg -n "optimizePackageImports" next.config.ts```
## Consequence
Roughly **570 KB** of icon code the app never renders ships on every authenticated page — the dozen used glyphs are a few KB, the rest is dead weight the browser still downloads, parses, and executes. Operator- and user-visible: a heavier main-thread parse before the nav is interactive, which shows up as INP regression on slow mobile devices (the budget is INP ≤ 200ms at p75), and wasted bytes on every authenticated navigation. Because the import lives in the shared `(protected)` layout, the cost is multiplied across the whole authenticated surface, not isolated to one route.
## Fix
This is the one in-place performance fix in the audit (slice S5) — the line is added to `next.config.ts`:
```tsexperimental: { optimizePackageImports: ['lucide-react'] },```
The seam rewrites every `lucide-react` barrel import to its per-icon module path at build, so only the referenced glyphs reach the bundle — the call sites in `layout.tsx` are untouched. This is the senior default over hand-converting each import to `lucide-react/dist/esm/icons/<icon>` per icon: per-icon imports work but are churn the next icon addition re-introduces, while the config entry is the single place the rule is configured (the "one seam" pattern). For an internal package the team owns, `sideEffects: false` in its `package.json` is the complementary lever — it tells the bundler the modules are tree-shakeable so a barrel re-export drops unused exports without needing `optimizePackageImports` at all.
After the fix, re-run `pnpm next experimental-analyze` and compare the treemap: the `lucide-react` tile collapses to the handful of used icons.
**Before / after the fix (the analyzer treemap, captured by the by-hand analyzer run):**


Half-credit converts the call sites to per-icon imports (it shrinks the bundle but is per-call-site churn); full credit names `optimizePackageImports` as the single seam, with `sideEffects: false` as the internal-package companion.Consequence. A byte count: ~570 KB of unused icon code on every authenticated page, an INP risk on slow mobile (budget ≤ 200ms p75).
# Finding 006 — `lucide-react` barrel import ships the whole icon set on every authenticated page
**Category:** Bundle size — the barrel-export trap + the Turbopack analyzer (chapter 094, lessons 3/4).**Severity:** high — the cost rides on the `(protected)` layout, so it lands on *every* authenticated page, and it is JavaScript the client must parse and execute before the nav is interactive (INP risk on slow mobile). Not critical because the page renders correctly and the fix is one config line, but it is the heaviest single avoidable weight in the authenticated bundle.
## Rule
A barrel import (`import { Home, FileText } from 'lucide-react'`) pulls the package's entire entry module — and therefore every re-exported icon — into the bundle when the bundler can't tree-shake it, so the build must be told to rewrite the import to per-icon module paths (chapter 094, lessons 3/4 — `the barrel-export trap` and `the Turbopack analyzer`). `experimental.optimizePackageImports` is the team-level seam: one config entry rewrites every barrel import of that package across the app, with no churn at the call sites.
## Location
- `src/app/(protected)/layout.tsx`, lines 1–13 — the nav imports ~a dozen icons (`Bell`, `Building2`, `CreditCard`, `FileText`, `HelpCircle`, `Home`, `LayoutDashboard`, `LogOut`, `Search`, `Settings`, `Users`) from the `lucide-react` **barrel**.- `next.config.ts` — the missing list entry: `lucide-react` was absent from `experimental.optimizePackageImports`, so nothing rewrote the barrel.
How it surfaced — the diagnostic surface is the analyzer treemap, not source. Run the Turbopack analyzer and open the report:
```pnpm next experimental-analyze```
It writes the treemap under `.next/diagnostics/analyze`. **Before** the fix a single `lucide-react` tile dominates the authenticated route's client bundle at roughly 600 KB — the whole icon set, not the dozen glyphs the nav uses. That oversized tile is the fingerprint; the grep below confirms the missing config entry:
```rg -n "optimizePackageImports" next.config.ts```
## Consequence
Roughly **570 KB** of icon code the app never renders ships on every authenticated page — the dozen used glyphs are a few KB, the rest is dead weight the browser still downloads, parses, and executes. Operator- and user-visible: a heavier main-thread parse before the nav is interactive, which shows up as INP regression on slow mobile devices (the budget is INP ≤ 200ms at p75), and wasted bytes on every authenticated navigation. Because the import lives in the shared `(protected)` layout, the cost is multiplied across the whole authenticated surface, not isolated to one route.
## Fix
This is the one in-place performance fix in the audit (slice S5) — the line is added to `next.config.ts`:
```tsexperimental: { optimizePackageImports: ['lucide-react'] },```
The seam rewrites every `lucide-react` barrel import to its per-icon module path at build, so only the referenced glyphs reach the bundle — the call sites in `layout.tsx` are untouched. This is the senior default over hand-converting each import to `lucide-react/dist/esm/icons/<icon>` per icon: per-icon imports work but are churn the next icon addition re-introduces, while the config entry is the single place the rule is configured (the "one seam" pattern). For an internal package the team owns, `sideEffects: false` in its `package.json` is the complementary lever — it tells the bundler the modules are tree-shakeable so a barrel re-export drops unused exports without needing `optimizePackageImports` at all.
After the fix, re-run `pnpm next experimental-analyze` and compare the treemap: the `lucide-react` tile collapses to the handful of used icons.
**Before / after the fix (the analyzer treemap, captured by the by-hand analyzer run):**


Half-credit converts the call sites to per-icon imports (it shrinks the bundle but is per-call-site churn); full credit names `optimizePackageImports` as the single seam, with `sideEffects: false` as the internal-package companion.Fix. The single optimizePackageImports line, plus the two embedded before/after screenshots that are this finding’s required evidence.
The two embedded screenshots are what the test checks for; produce them by running the analyzer before the config edit and again after. For the barrel trap and the analyzer, see Barrel files and tree-shaking and Reading the bundle treemap.
The one in-place fix — next.config.ts
Section titled “The one in-place fix — next.config.ts”The starter carries a TODO(L6) where the line belongs; you replace it with the experimental entry.
// TODO(L6) — add the lucide-react barrel fix here under experimental (finding 6): list// the icon package so the build rewrites the (protected) layout's barrel import to// per-icon module paths. See findings/006-barrel-import.md.const nextConfig: NextConfig = { cacheComponents: true, typedRoutes: true, reactCompiler: true, turbopack: { root: __dirname }, // …rewrites, headers…};The starter has no experimental key, so nothing rewrites the barrel.
const nextConfig: NextConfig = { cacheComponents: true, typedRoutes: true, reactCompiler: true, experimental: { optimizePackageImports: ['lucide-react'] }, // …rewrites, headers…};optimizePackageImports sits under the experimental key, as Next.js 16.2 still requires.
Placement is the one detail to get right, and the test asserts it: optimizePackageImports lives under experimental, not as a top-level key. With the line in, the build rewrites every lucide-react barrel import to per-icon paths, and a second pnpm next experimental-analyze run shows the collapsed tile that finding 006 embeds.
Finding 008 — the N+1 in the invoice helper
Section titled “Finding 008 — the N+1 in the invoice helper”The dashboard’s invoice helper reads the invoice rows in one query, then loops to fetch each invoice’s customer separately:
// 1 query: the invoice rows.const rows = await db  .select()  .from(invoices)  .where(eq(invoices.organizationId, orgId))  .orderBy(desc(invoices.createdAt))  .limit(limit);
// SEEDED #8: N queries — one customer lookup per invoice, in a loop.const result: InvoiceWithCustomer[] = [];for (const invoice of rows) {  const [customer] = await db    .select()    .from(customers)    .where(eq(customers.id, invoice.customerId))    .limit(1);  result.push({ ...invoice, customer: customer ?? null });}
That is 1 + N queries per render; dumping the loop’s statement with .toSQL() confirms the count.
# Finding 008 — N+1 in the dashboard invoice list: one query per invoice for its customer
**Category:** N+1 at the database layer (chapter 094, lesson 7).**Severity:** medium — the data is correct and a single dashboard render is tolerable at seed scale, but the query count grows linearly with the invoice list and each round-trip holds a connection, so it degrades and risks pool exhaustion as the org grows. Medium, not high: no data is lost and the fix is a one-statement rewrite, but it is a latency cliff that gets worse with real data.
## Rule
Reading a parent list and then fetching each row's related record in a loop is the N+1 anti-pattern: it issues 1 query for the list plus N queries for the relations, where the relations API would issue one (chapter 094, lesson 7 — `N+1 queries and the Drizzle relations API`). Drizzle relations v1 (`db.query.<table>.findMany({ with: { ... } })`) emits a single lateral-join statement — the old "the ORM secretly N+1s" fear does not apply here.
## Location
`src/db/queries/invoices-with-customer.ts`, lines 22–48 — `listInvoicesWithCustomer` runs one `db.select().from(invoices)` for the org's rows, then **loops** over them firing a separate `db.select().from(customers)` per invoice (`for (const invoice of rows) { … }`). This is the dedicated dashboard helper; the healthy `src/db/queries/invoices.ts` (`listInvoices`) already uses the relations API and stays healthy — the N+1 lives only in this file.
How it surfaced — the diagnostic surface is the query log, confirmed with `.toSQL()`. A DevTools/Sentry trace of the `/dashboard` render shows **1 + N** database spans — one invoice select followed by a fan of identical single-row customer selects, one per invoice. Confirm by dumping the loop's statement:
```tsconsole.log(  db.select().from(customers).where(eq(customers.id, id)).toSQL(),);```
`.toSQL()` prints one `select … from customers where id = $1` per call — N of them — against the single invoice select. With the seeded ≥30 invoices that is 31 statements where 1 is reachable.
## Consequence
The render fires **1 + N** queries — 31 with the seeded data, growing one-for-one with the invoice count. Each is a separate network round-trip that holds a pooled connection for its duration, so the dashboard accumulates roughly 50ms of avoidable latency at seed scale and far more as the list grows, and under concurrent loads the fan of per-invoice queries is a connection-pool exhaustion risk (every in-flight dashboard render checks out a connection per invoice). Operator-visible: a slow dashboard that gets slower as the customer base grows, with a query count that scales with the data instead of staying flat.
## Fix
Documented, not patched — the helper keeps the loop so the N+1 stays readable in a trace. The senior reach is the relations API, which collapses the 1 + N into one statement:
```tsconst rows = await db.query.invoices.findMany({  where: eq(invoices.organizationId, orgId),  orderBy: desc(invoices.createdAt),  limit,  with: { customer: true },});```
The `invoicesRelations` declaration in `src/db/schema.ts` (`customer: one(customers, …)`) is already in place, so `with: { customer: true }` expands the customer onto each invoice in a **single lateral-join statement** — verify with `.toSQL()` (one `select … left join lateral …`, not N selects). This drops the query count from `1 + N` to `1`, flat regardless of list size.
Half-credit hand-writes an `innerJoin`/`leftJoin` in the core query builder (it removes the N+1 but reintroduces manual row-shaping the relations API does for free); full credit uses `findMany({ with: { customer: true } })` and verifies the single statement with `.toSQL()`.
Category (N+1 at the database layer, chapter 094 lesson 7) and Severity medium: correct data, but a latency cliff that worsens linearly with the invoice list.
# Finding 008 — N+1 in the dashboard invoice list: one query per invoice for its customer
**Category:** N+1 at the database layer (chapter 094, lesson 7).**Severity:** medium — the data is correct and a single dashboard render is tolerable at seed scale, but the query count grows linearly with the invoice list and each round-trip holds a connection, so it degrades and risks pool exhaustion as the org grows. Medium, not high: no data is lost and the fix is a one-statement rewrite, but it is a latency cliff that gets worse with real data.
## Rule
Reading a parent list and then fetching each row's related record in a loop is the N+1 anti-pattern: it issues 1 query for the list plus N queries for the relations, where the relations API would issue one (chapter 094, lesson 7 — `N+1 queries and the Drizzle relations API`). Drizzle relations v1 (`db.query.<table>.findMany({ with: { ... } })`) emits a single lateral-join statement — the old "the ORM secretly N+1s" fear does not apply here.
## Location
`src/db/queries/invoices-with-customer.ts`, lines 22–48 — `listInvoicesWithCustomer` runs one `db.select().from(invoices)` for the org's rows, then **loops** over them firing a separate `db.select().from(customers)` per invoice (`for (const invoice of rows) { … }`). This is the dedicated dashboard helper; the healthy `src/db/queries/invoices.ts` (`listInvoices`) already uses the relations API and stays healthy — the N+1 lives only in this file.
How it surfaced — the diagnostic surface is the query log, confirmed with `.toSQL()`. A DevTools/Sentry trace of the `/dashboard` render shows **1 + N** database spans — one invoice select followed by a fan of identical single-row customer selects, one per invoice. Confirm by dumping the loop's statement:
```tsconsole.log(  db.select().from(customers).where(eq(customers.id, id)).toSQL(),);```
`.toSQL()` prints one `select … from customers where id = $1` per call — N of them — against the single invoice select. With the seeded ≥30 invoices that is 31 statements where 1 is reachable.
## Consequence
The render fires **1 + N** queries — 31 with the seeded data, growing one-for-one with the invoice count. Each is a separate network round-trip that holds a pooled connection for its duration, so the dashboard accumulates roughly 50ms of avoidable latency at seed scale and far more as the list grows, and under concurrent loads the fan of per-invoice queries is a connection-pool exhaustion risk (every in-flight dashboard render checks out a connection per invoice). Operator-visible: a slow dashboard that gets slower as the customer base grows, with a query count that scales with the data instead of staying flat.
## Fix
Documented, not patched — the helper keeps the loop so the N+1 stays readable in a trace. The senior reach is the relations API, which collapses the 1 + N into one statement:
```tsconst rows = await db.query.invoices.findMany({  where: eq(invoices.organizationId, orgId),  orderBy: desc(invoices.createdAt),  limit,  with: { customer: true },});```
The `invoicesRelations` declaration in `src/db/schema.ts` (`customer: one(customers, …)`) is already in place, so `with: { customer: true }` expands the customer onto each invoice in a **single lateral-join statement** — verify with `.toSQL()` (one `select … left join lateral …`, not N selects). This drops the query count from `1 + N` to `1`, flat regardless of list size.
Half-credit hand-writes an `innerJoin`/`leftJoin` in the core query builder (it removes the N+1 but reintroduces manual row-shaping the relations API does for free); full credit uses `findMany({ with: { customer: true } })` and verifies the single statement with `.toSQL()`.
Rule. Read-a-list-then-loop is N+1: 1 query plus N for the relations, where the Drizzle relations API issues exactly one.
# Finding 008 — N+1 in the dashboard invoice list: one query per invoice for its customer
**Category:** N+1 at the database layer (chapter 094, lesson 7).**Severity:** medium — the data is correct and a single dashboard render is tolerable at seed scale, but the query count grows linearly with the invoice list and each round-trip holds a connection, so it degrades and risks pool exhaustion as the org grows. Medium, not high: no data is lost and the fix is a one-statement rewrite, but it is a latency cliff that gets worse with real data.
## Rule
Reading a parent list and then fetching each row's related record in a loop is the N+1 anti-pattern: it issues 1 query for the list plus N queries for the relations, where the relations API would issue one (chapter 094, lesson 7 — `N+1 queries and the Drizzle relations API`). Drizzle relations v1 (`db.query.<table>.findMany({ with: { ... } })`) emits a single lateral-join statement — the old "the ORM secretly N+1s" fear does not apply here.
## Location
`src/db/queries/invoices-with-customer.ts`, lines 22–48 — `listInvoicesWithCustomer` runs one `db.select().from(invoices)` for the org's rows, then **loops** over them firing a separate `db.select().from(customers)` per invoice (`for (const invoice of rows) { … }`). This is the dedicated dashboard helper; the healthy `src/db/queries/invoices.ts` (`listInvoices`) already uses the relations API and stays healthy — the N+1 lives only in this file.
How it surfaced — the diagnostic surface is the query log, confirmed with `.toSQL()`. A DevTools/Sentry trace of the `/dashboard` render shows **1 + N** database spans — one invoice select followed by a fan of identical single-row customer selects, one per invoice. Confirm by dumping the loop's statement:
```tsconsole.log(  db.select().from(customers).where(eq(customers.id, id)).toSQL(),);```
`.toSQL()` prints one `select … from customers where id = $1` per call — N of them — against the single invoice select. With the seeded ≥30 invoices that is 31 statements where 1 is reachable.
## Consequence
The render fires **1 + N** queries — 31 with the seeded data, growing one-for-one with the invoice count. Each is a separate network round-trip that holds a pooled connection for its duration, so the dashboard accumulates roughly 50ms of avoidable latency at seed scale and far more as the list grows, and under concurrent loads the fan of per-invoice queries is a connection-pool exhaustion risk (every in-flight dashboard render checks out a connection per invoice). Operator-visible: a slow dashboard that gets slower as the customer base grows, with a query count that scales with the data instead of staying flat.
## Fix
Documented, not patched — the helper keeps the loop so the N+1 stays readable in a trace. The senior reach is the relations API, which collapses the 1 + N into one statement:
```tsconst rows = await db.query.invoices.findMany({  where: eq(invoices.organizationId, orgId),  orderBy: desc(invoices.createdAt),  limit,  with: { customer: true },});```
The `invoicesRelations` declaration in `src/db/schema.ts` (`customer: one(customers, …)`) is already in place, so `with: { customer: true }` expands the customer onto each invoice in a **single lateral-join statement** — verify with `.toSQL()` (one `select … left join lateral …`, not N selects). This drops the query count from `1 + N` to `1`, flat regardless of list size.
Half-credit hand-writes an `innerJoin`/`leftJoin` in the core query builder (it removes the N+1 but reintroduces manual row-shaping the relations API does for free); full credit uses `findMany({ with: { customer: true } })` and verifies the single statement with `.toSQL()`.
Location. Only the dedicated invoices-with-customer.ts helper; the healthy invoices.ts stays healthy, which keeps the grep falsifiable. Surfaced by the 1+N trace, confirmed with .toSQL().
# Finding 008 — N+1 in the dashboard invoice list: one query per invoice for its customer
**Category:** N+1 at the database layer (chapter 094, lesson 7).**Severity:** medium — the data is correct and a single dashboard render is tolerable at seed scale, but the query count grows linearly with the invoice list and each round-trip holds a connection, so it degrades and risks pool exhaustion as the org grows. Medium, not high: no data is lost and the fix is a one-statement rewrite, but it is a latency cliff that gets worse with real data.
## Rule
Reading a parent list and then fetching each row's related record in a loop is the N+1 anti-pattern: it issues 1 query for the list plus N queries for the relations, where the relations API would issue one (chapter 094, lesson 7 — `N+1 queries and the Drizzle relations API`). Drizzle relations v1 (`db.query.<table>.findMany({ with: { ... } })`) emits a single lateral-join statement — the old "the ORM secretly N+1s" fear does not apply here.
## Location
`src/db/queries/invoices-with-customer.ts`, lines 22–48 — `listInvoicesWithCustomer` runs one `db.select().from(invoices)` for the org's rows, then **loops** over them firing a separate `db.select().from(customers)` per invoice (`for (const invoice of rows) { … }`). This is the dedicated dashboard helper; the healthy `src/db/queries/invoices.ts` (`listInvoices`) already uses the relations API and stays healthy — the N+1 lives only in this file.
How it surfaced — the diagnostic surface is the query log, confirmed with `.toSQL()`. A DevTools/Sentry trace of the `/dashboard` render shows **1 + N** database spans — one invoice select followed by a fan of identical single-row customer selects, one per invoice. Confirm by dumping the loop's statement:
```tsconsole.log(  db.select().from(customers).where(eq(customers.id, id)).toSQL(),);```
`.toSQL()` prints one `select … from customers where id = $1` per call — N of them — against the single invoice select. With the seeded ≥30 invoices that is 31 statements where 1 is reachable.
## Consequence
The render fires **1 + N** queries — 31 with the seeded data, growing one-for-one with the invoice count. Each is a separate network round-trip that holds a pooled connection for its duration, so the dashboard accumulates roughly 50ms of avoidable latency at seed scale and far more as the list grows, and under concurrent loads the fan of per-invoice queries is a connection-pool exhaustion risk (every in-flight dashboard render checks out a connection per invoice). Operator-visible: a slow dashboard that gets slower as the customer base grows, with a query count that scales with the data instead of staying flat.
## Fix
Documented, not patched — the helper keeps the loop so the N+1 stays readable in a trace. The senior reach is the relations API, which collapses the 1 + N into one statement:
```tsconst rows = await db.query.invoices.findMany({  where: eq(invoices.organizationId, orgId),  orderBy: desc(invoices.createdAt),  limit,  with: { customer: true },});```
The `invoicesRelations` declaration in `src/db/schema.ts` (`customer: one(customers, …)`) is already in place, so `with: { customer: true }` expands the customer onto each invoice in a **single lateral-join statement** — verify with `.toSQL()` (one `select … left join lateral …`, not N selects). This drops the query count from `1 + N` to `1`, flat regardless of list size.
Half-credit hand-writes an `innerJoin`/`leftJoin` in the core query builder (it removes the N+1 but reintroduces manual row-shaping the relations API does for free); full credit uses `findMany({ with: { customer: true } })` and verifies the single statement with `.toSQL()`.
Consequence. A query count: 31 statements at seed scale, each holding a pooled connection, a pool-exhaustion risk under load.
# Finding 008 — N+1 in the dashboard invoice list: one query per invoice for its customer
**Category:** N+1 at the database layer (chapter 094, lesson 7).**Severity:** medium — the data is correct and a single dashboard render is tolerable at seed scale, but the query count grows linearly with the invoice list and each round-trip holds a connection, so it degrades and risks pool exhaustion as the org grows. Medium, not high: no data is lost and the fix is a one-statement rewrite, but it is a latency cliff that gets worse with real data.
## Rule
Reading a parent list and then fetching each row's related record in a loop is the N+1 anti-pattern: it issues 1 query for the list plus N queries for the relations, where the relations API would issue one (chapter 094, lesson 7 — `N+1 queries and the Drizzle relations API`). Drizzle relations v1 (`db.query.<table>.findMany({ with: { ... } })`) emits a single lateral-join statement — the old "the ORM secretly N+1s" fear does not apply here.
## Location
`src/db/queries/invoices-with-customer.ts`, lines 22–48 — `listInvoicesWithCustomer` runs one `db.select().from(invoices)` for the org's rows, then **loops** over them firing a separate `db.select().from(customers)` per invoice (`for (const invoice of rows) { … }`). This is the dedicated dashboard helper; the healthy `src/db/queries/invoices.ts` (`listInvoices`) already uses the relations API and stays healthy — the N+1 lives only in this file.
How it surfaced — the diagnostic surface is the query log, confirmed with `.toSQL()`. A DevTools/Sentry trace of the `/dashboard` render shows **1 + N** database spans — one invoice select followed by a fan of identical single-row customer selects, one per invoice. Confirm by dumping the loop's statement:
```tsconsole.log(  db.select().from(customers).where(eq(customers.id, id)).toSQL(),);```
`.toSQL()` prints one `select … from customers where id = $1` per call — N of them — against the single invoice select. With the seeded ≥30 invoices that is 31 statements where 1 is reachable.
## Consequence
The render fires **1 + N** queries — 31 with the seeded data, growing one-for-one with the invoice count. Each is a separate network round-trip that holds a pooled connection for its duration, so the dashboard accumulates roughly 50ms of avoidable latency at seed scale and far more as the list grows, and under concurrent loads the fan of per-invoice queries is a connection-pool exhaustion risk (every in-flight dashboard render checks out a connection per invoice). Operator-visible: a slow dashboard that gets slower as the customer base grows, with a query count that scales with the data instead of staying flat.
## Fix
Documented, not patched — the helper keeps the loop so the N+1 stays readable in a trace. The senior reach is the relations API, which collapses the 1 + N into one statement:
```tsconst rows = await db.query.invoices.findMany({  where: eq(invoices.organizationId, orgId),  orderBy: desc(invoices.createdAt),  limit,  with: { customer: true },});```
The `invoicesRelations` declaration in `src/db/schema.ts` (`customer: one(customers, …)`) is already in place, so `with: { customer: true }` expands the customer onto each invoice in a **single lateral-join statement** — verify with `.toSQL()` (one `select … left join lateral …`, not N selects). This drops the query count from `1 + N` to `1`, flat regardless of list size.
Half-credit hand-writes an `innerJoin`/`leftJoin` in the core query builder (it removes the N+1 but reintroduces manual row-shaping the relations API does for free); full credit uses `findMany({ with: { customer: true } })` and verifies the single statement with `.toSQL()`.
Fix. findMany({ with: { customer: true } }): one lateral-join statement, verified with .toSQL(). A hand-written join is the half-credit path.
For the N+1 anti-pattern and the relations API, see Indexes and N+1 in production.
Bonus finding 010 — the missing composite index
Section titled “Bonus finding 010 — the missing composite index”The bonus reaches past the eight-finding floor, on the same /dashboard read path. The invoices table ships with only its primary key, so the org-scoped, created_at-ordered read has no (organization_id, created_at) index to serve it.
You find it with EXPLAIN ANALYZE. Dump the plan for the dashboard read against the seeded data:
EXPLAIN ANALYZESELECT * FROM invoicesWHERE organization_id = '<seeded-org-id>'ORDER BY created_at DESCLIMIT 30;The plan shows a Seq Scan on invoices feeding an in-memory Sort: the planner reads every row, then sorts because nothing arrives pre-sorted. Those two nodes are the fingerprint.
The fix has two halves. First, declare the composite index in the schema, leftmost-prefix organization_id, then created_at, then id so the ordering is total and the cursor stable:
export const invoices = pgTable( 'invoices', { /* …columns… */ }, (t) => [ index('idx_invoices_org_created').on( t.organizationId, t.createdAt, t.id, ), ],);Second, generate and apply the migration: pnpm db:generate --name index_invoices_org_created emits the CREATE INDEX, then pnpm db:migrate runs it. The schema declaration is only intent until the migration runs, so naming the index without generating the migration is half-credit. Re-run EXPLAIN ANALYZE and the Seq Scan plus Sort collapses to an Index Scan using idx_invoices_org_created.
The full finding follows the same template in findings/010-composite-index.md in the solution tree. For indexes and reading query plans, see Indexes and N+1 in production.
SUMMARY.md — the coverage scorecard
Section titled “SUMMARY.md — the coverage scorecard”SUMMARY.md proves the audit was systematic. It opens with the coverage line, 10/10, the 8/8 floor plus both bonuses, then a table with one row per finding:
**10/10** — the 8/8 floor (one finding per category) plus both bonus findings.
| # | Finding | Category | Half | Severity ||---|---|---|---|---|| 001 | Sentry not wired | Error monitoring (092 L1) | wired | critical || 002 | `stripe-signature` logged in the clear | Structured logs / 3am rule (092 L3) | wired | high || 003 | No request correlation id | Structured logs / correlation (092 L2) | wired | medium || 004 | PostHog captures before consent | Consent-gated analytics (093 L3, 081 L5) | wired | high || 005 | Dashboard RSC waterfall | RSC waterfall (094 L6) | documented | medium || 006 | `lucide-react` barrel import | Bundle size / barrel + analyzer (094 L3/L4) | documented (one-line fix) | high || 007 | Missing `preload` on the LCP hero | LCP / Core Web Vitals (094 L2) | documented | high || 008 | N+1 in the invoice list | N+1 at the DB layer (094 L7) | documented | medium || 009 | Marketing font via raw `<link>` | LCP / Core Web Vitals (094 L1/L2) | bonus, documented | medium || 010 | Missing `(org_id, created_at)` index | Missing DB index (094 L7) | bonus, documented | medium |
The Half column records how each finding closed: the four observability findings are wired (the diff from starter to solution), the performance findings and both bonuses are documented, save finding 006’s one config line. Below the table sit the scoring rubric and the per-finding reach detail, then the two verdicts:
- Observability gaps (001–004) close before launch. They lose data — an invisible incident, a leaked secret, an unjoinable trace, behavior captured without consent. You cannot recover the error you never saw or the consent you never asked for.
- Performance gaps (005–008, 009, 010) go to the backlog with measured impact. They are slow, not bleeding — the app renders correct data, just heavier or later. They ship documented (with the timing, the byte count, the query count, the plan node) so the team can prioritize them against feature work.
Paste finding 006’s after-fix treemap into SUMMARY.md as secondary evidence for the bundle-size half.
out-of-scope.md — keeping the count honest
Section titled “out-of-scope.md — keeping the count honest”An audit scores against its declared categories. Two things fall outside them, worth recording so a later pass can pick them up but not counted toward coverage:
## Observations
- **Denormalized `customerName` on `invoices` duplicates the `customers.name` it now references.** `src/db/schema.ts` (the `invoices` table) keeps a `customerName` text column from the pre-095 lineage *and* a `customerId` FK to the new `customers` table (and the `customer` relation). The name now lives in two places, so a customer rename leaves the invoice's `customerName` stale unless every write updates both. This is a data-modeling / code-quality observation — drop `customerName` and read the name through the relation, or keep it as a deliberate point-in-time snapshot (the name *as billed*) and document that intent. It is **not** one of the eight categories, so it is recorded here, not scored.
- **The `/api/test/throw` route is a deliberate diagnostic affordance, not a defect.** `src/app/api/test/throw/route.ts` throws unconditionally on `GET`. In a real review this would read as a finding ("an unguarded route that 500s"), but here it is the *provided proof target* for finding 001's deliberate-throw test, documented in the README. Recording it as out-of-scope is the honest move: name why it is intentional so a future audit doesn't re-flag it, and note that it must not ship to production (gate it behind a non-production env check before launch). Not scored — it is test scaffolding, not a category defect.
Each fix names a primary reference doc; pull these up as you write the Fix sections so the config key, the relations-API call, and the plan-node names match the source of truth.
Next.js config reference for the barrel fix in finding 006 — confirms it stays under experimental and that lucide-react is a supported package.
The findMany({ with: { customer: true } }) API for the N+1 fix in finding 008 — and its single-SQL-query guarantee you verify with .toSQL().
PostgreSQL reference for reading EXPLAIN ANALYZE plans — Seq Scan, Sort, and Index Scan nodes you cite in the composite-index bonus.
Moment of truth
Section titled “Moment of truth”Run the lesson’s test suite:
pnpm test:lesson 6A green run confirms the source-shape probes: each finding file has its four sections, cites the right chapter 094 rule, locates the defect, and names the fix; finding 006 embeds both screenshots; and next.config.ts lists lucide-react under experimental.optimizePackageImports. It also checks that you documented the waterfall and N+1 rather than patching them: dashboard/page.tsx still awaits sequentially, and the invoice helper still loops.
 ✓ tests/lessons/Lesson 6.test.ts (30 tests)   ✓ Req 1 — finding 005 documents the dashboard RSC waterfall   ✓ Req 2 — finding 006 documents the lucide-react barrel import   ✓ Req 3 — finding 008 documents the N+1 in the invoice helper   ✓ Req 4 — next.config.ts applies the barrel fix under experimental   ✓ Constraint — the waterfall and N+1 stay in source (document, do not patch)
 Test Files  1 passed (1)      Tests  30 passed (30)
The tests check file shape, not whether your numbers are real. Confirm that by hand at three surfaces: the Turbopack analyzer treemap, the DevTools Performance panel or Sentry trace, and the EXPLAIN ANALYZE query plan.
findings/005-rsc-waterfall.md and findings/008-n-plus-1-invoices.md each carry all four sections, and every Consequence is a timing or a query count — never a hedge.lucide-react tile drops sharply across the two pnpm next experimental-analyze runs — capture both treemaps and confirm the collapse is real.findings/006-barrel-import.md embeds both before/after screenshots, and they render.findings/SUMMARY.md states coverage, names the two verdicts, and pastes the final analyzer treemap; out-of-scope.md records the deliberate cuts.findings/010-composite-index.md names the composite index and the generated migration, and the EXPLAIN ANALYZE plan flips from Seq Scan + Sort to Index Scan.pnpm dev runs, and the waterfall, N+1, and missing index are still in source.The next lesson runs the full verification, commits the work, and self-grades it against the answer key, closing the audit.